This is part three of a multi-part series reviewing Canada’s Anti-Spam Legislation in practice since its introduction in 2014 and the beginnings of enforcement in 2015. Crosslinks will be added as new parts go up.
Part 1: Terminology
Part 4: Case File – Compu-Finder
Part 5: Case File Anthology, 2015-2016
Part 6: Case File – Blackstone Education
Part 7: Case File Anthology, 2017-2018
Part 8: Case File – Brian Conley/nCrowd
Part 9: Case File Anthology, 2019-2022
Core resources:
Enforcement Actions Table (CASL selected)
With the 10th year anniversary of Canada’s Anti-Spam Legislation coming up in a few months, it’s beneficial to run through the data they provide (starting in 2018).
My interests here are chiefly:
- establishing whether or not the overall rate of spam is going down
- gaining some understanding of the likelihood of a significant action being imposed on an organization
On the first, CASL itself reports on the number of complaints it receives over time. I’ve aggregated these from their reports, such as the Sept. 2022 – March 2023 report presented here.
Based on complaints to regulators, is spam diminishing over time?
The number of complaints about unsolicited CEMs over time wobbles, but stays within a rough 140,000-170,000 range, trending up steadily since COVID.
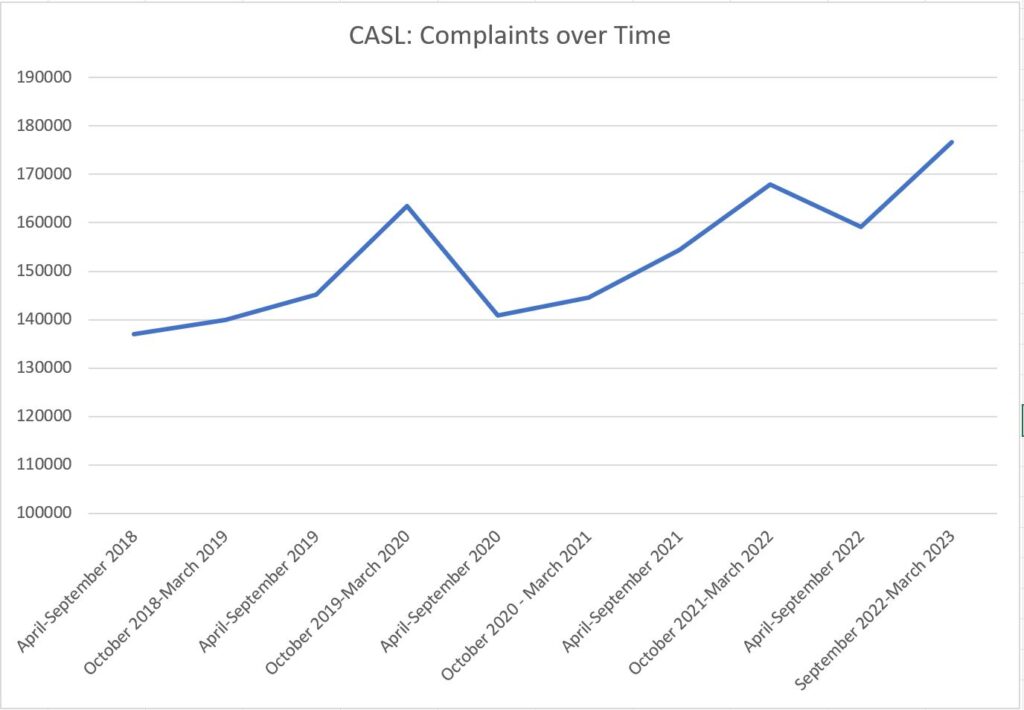
On its face, then, the presence of the legislation isn’t slowing the rate of complaints about unsolicited messages.
Careful phrasing, there: I don’t want to say that the legislation is not having an effect on spam. All we’re seeing here is that complaints about spam are staying high and gently rising over time following a 2020 dip (COVID?) This could feel like it means “spam is not going down,” but there are counter-arguments to that – it may not be that spam is not decreasing, per se, but that growing awareness of CASL means that reporting rates are going up: people can recognize spam more readily, and know it is easy to report.
Even if you take the complaint number as representing spam volume overall, there are (at least) two arguments one could make that CASL is effective:
- Spam would be growing unchecked were it not for CASL, and relatively flat numbers are a proof of its success.1Why do police budgets keep going up while crime rates fall? Because enough politicians believe that if we don’t keep buying military hardware for the police, crime will suddenly rise. I’m not a subscriber to this line of thought, and think declines in crime are more provably attributable to things the police have very little to do with — education, social services, access to mental health supports and healthcare — but this line of thought exists, and there’s no reason it shouldn’t apply to CASL as it applies to street crime.
- Complaints aren’t really the right tool to measure its effectiveness: the legislation isn’t really about stopping commercial electronic messages (CEMs) entirely, but consumer and marketer education.
The best test would be to compare complaint rates with those from a country that has no CASL-type legislation or enforcement. Unfortunately, CASL is the reporting structure as well as the enforcement unit — if there are countries that track spam complaints but don’t have any mechanisms for controlling spam, please let me know.
What about the other easily measured numbers: notices to produce, and preservation demands – both easily interpreted as preludes to enforcement?
The graphs are a bit more jagged, due to the smaller overall numbers, and reflect a “ramping up” of CASL following its introduction – the complaints came hard and fast initially, but it clearly took some time to respond to them and begin issuing notices:
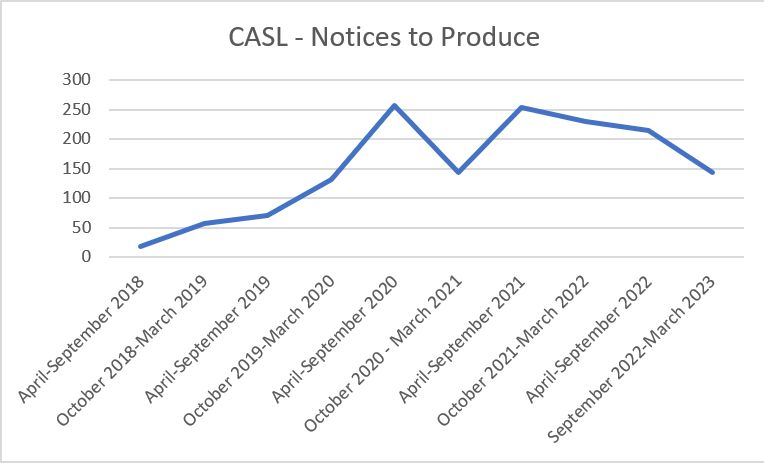
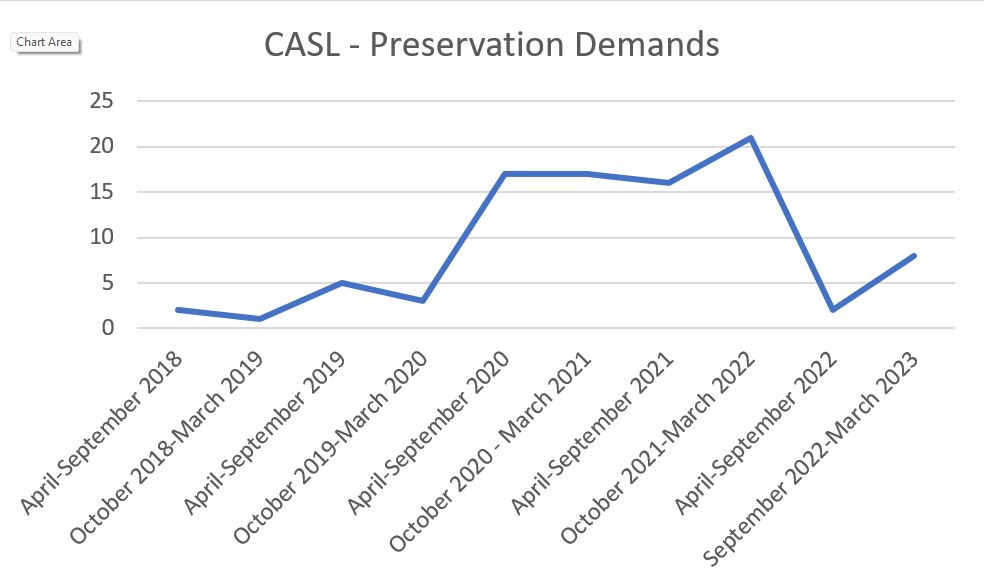
It feels like it took the CRTC a couple of years to hit its stride with Notices to Produce and Preservation Demands,2please see the Terminology blog post for descriptions of these! with complaints flowing in out of the gate and some ramping up of the tools and processes for investigation, with a fairly steady state since 2020 in terms of notices to produce and preservation demands. Until our most recent periods, anyway. I thought I’d identified a wave – notices to produce in one six-month span create higher preservation demands in the next – but the above shows that’s wrong.
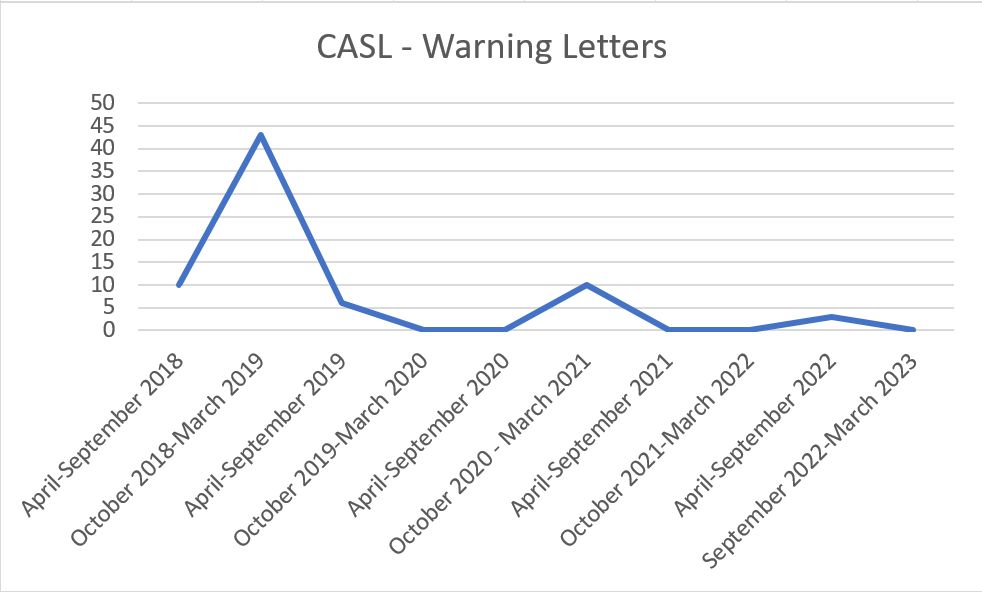
Warning letters are very different – a (relatively) large burst in 2019, and then not much at all. I would have expected a consistency here, and can only speculate that the Commission has at some point decided that NoPs and preservation demands are more effective.
The complaints chart looks very smooth compared to the notices/preservation/warning charts because the scale of the numbers is different. Taking a reasonably high period for notices and demands (April-September 2020), here’s how they compare:
| Complaints | Notices to Produce | Preservation Demands |
| 140945 | 257 | 17 |
That is a whopping ratio: almost 550 complaints per notice to produce.
About 8300 complaints per preservation demand.
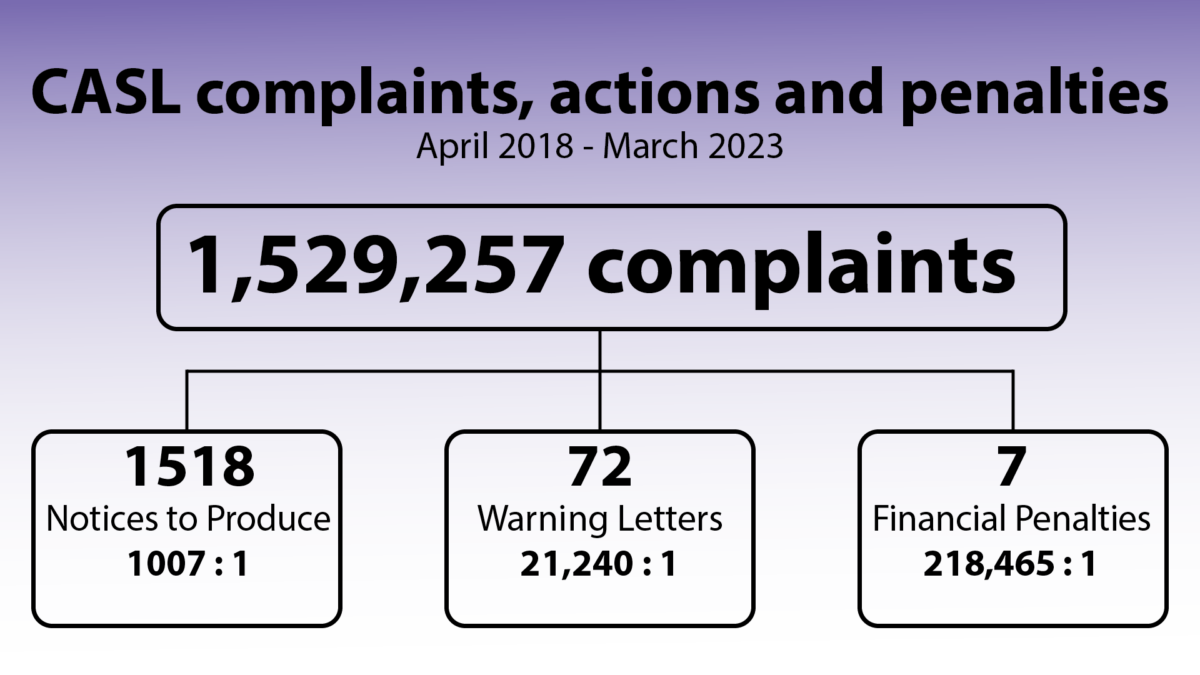
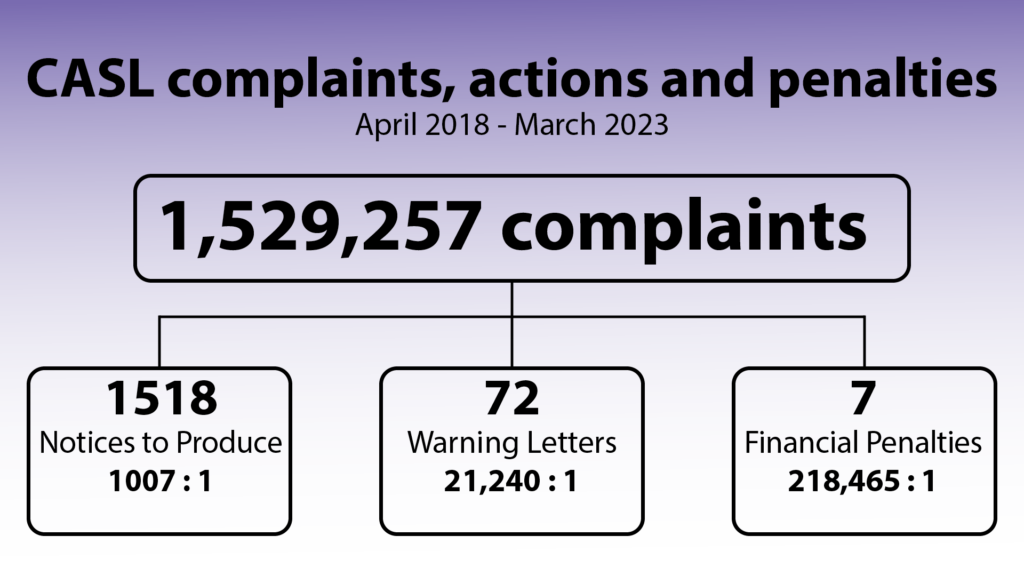
And if you dig into the actual actions beyond the “warning shots” of notices to produce, preservation demands and warning letters, the number gets very small indeed. From April 2018 to present, the ratios are:
1,529,257 complaints total 3This project overall might be read as critical of CASL, and I just want to be clear that processing 1.5 million complaints is nothing short of heroic. We’ll be getting to conclusions eventually, but please remember this number — I don’t know how many people are staffing the CASL project, but 1.5 million complaints in five years is an incredible amount of work to manage.
18,785 complaints per warning letter
21,240 complaints per preservation demand
1007 complaints per notice to produce4We have to be clear that this is not a magic number; when we get into looking at specific cases, sometimes a very low number of complaints ultimately result in a notice, preservation demand, or AMP. Saying “if less than a thousand people complain, nothing will happen” shouldn’t be the takeaway here!
There have been 16 undertakings and/or decisions with financial penalties issued since 2014. Nine happened prior to 2018, when complaint numbers started being made publicly available, so if we measure from when these stats were published, we arrive at 1,529,257 total complaints resulting in seven announced penalties – many of those later being reduced or ultimately not imposed (stay tuned for closer looks at the decisions and – more importantly – the follow-throughs).
That math breaks down to over 218,000 complaints per announced penalty.
That feels like a lot of complaints ultimately leading to a penalty (or in some cases, no penalty after all).
A summary in convenient graphic form, with tasteful gradient background:
Arguably, warning letters and notices to produce are the deterrent, and the issue rate of warning letters / NOPs is chilling violators, and focusing solely on AMPs is a bit too narrow – but CASL likes to broadcast the dollar values of penalties levied on every report, so I think it’s fair enough to zero in on those as the key factor.
Next post, we’ll start to look at the actual decisions – those seven penalties – and poke at their stories a bit. It’s interesting stuff, I promise.
- 1Why do police budgets keep going up while crime rates fall? Because enough politicians believe that if we don’t keep buying military hardware for the police, crime will suddenly rise. I’m not a subscriber to this line of thought, and think declines in crime are more provably attributable to things the police have very little to do with — education, social services, access to mental health supports and healthcare — but this line of thought exists, and there’s no reason it shouldn’t apply to CASL as it applies to street crime.
- 2please see the Terminology blog post for descriptions of these!
- 3This project overall might be read as critical of CASL, and I just want to be clear that processing 1.5 million complaints is nothing short of heroic. We’ll be getting to conclusions eventually, but please remember this number — I don’t know how many people are staffing the CASL project, but 1.5 million complaints in five years is an incredible amount of work to manage.
- 4We have to be clear that this is not a magic number; when we get into looking at specific cases, sometimes a very low number of complaints ultimately result in a notice, preservation demand, or AMP. Saying “if less than a thousand people complain, nothing will happen” shouldn’t be the takeaway here!