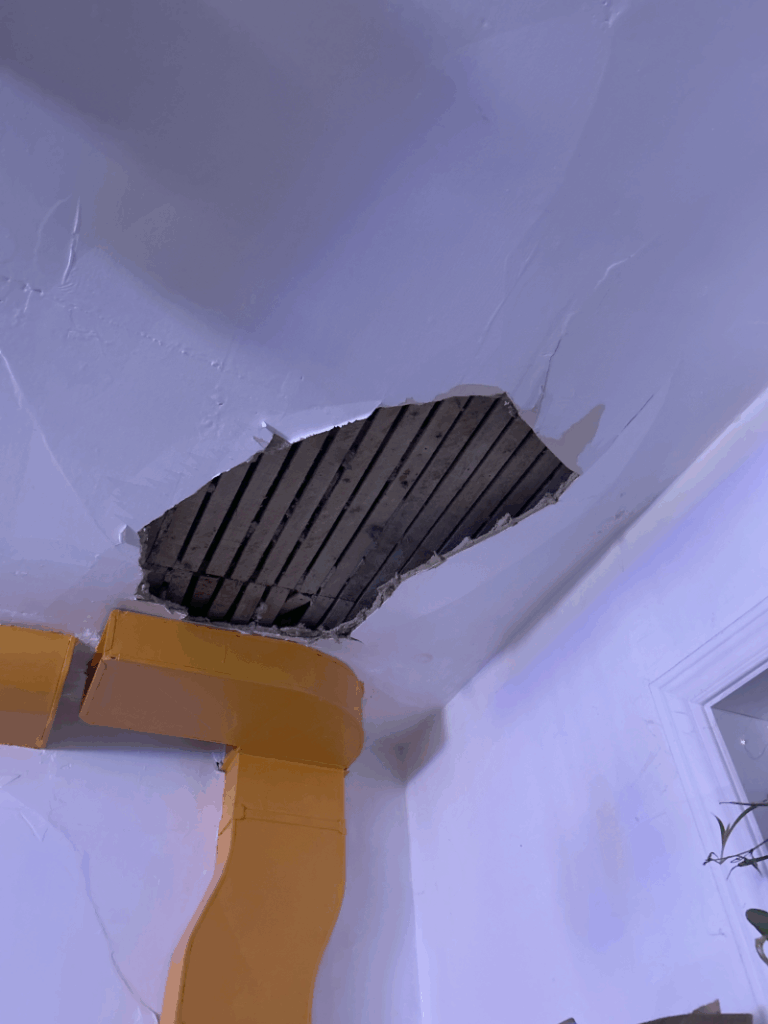
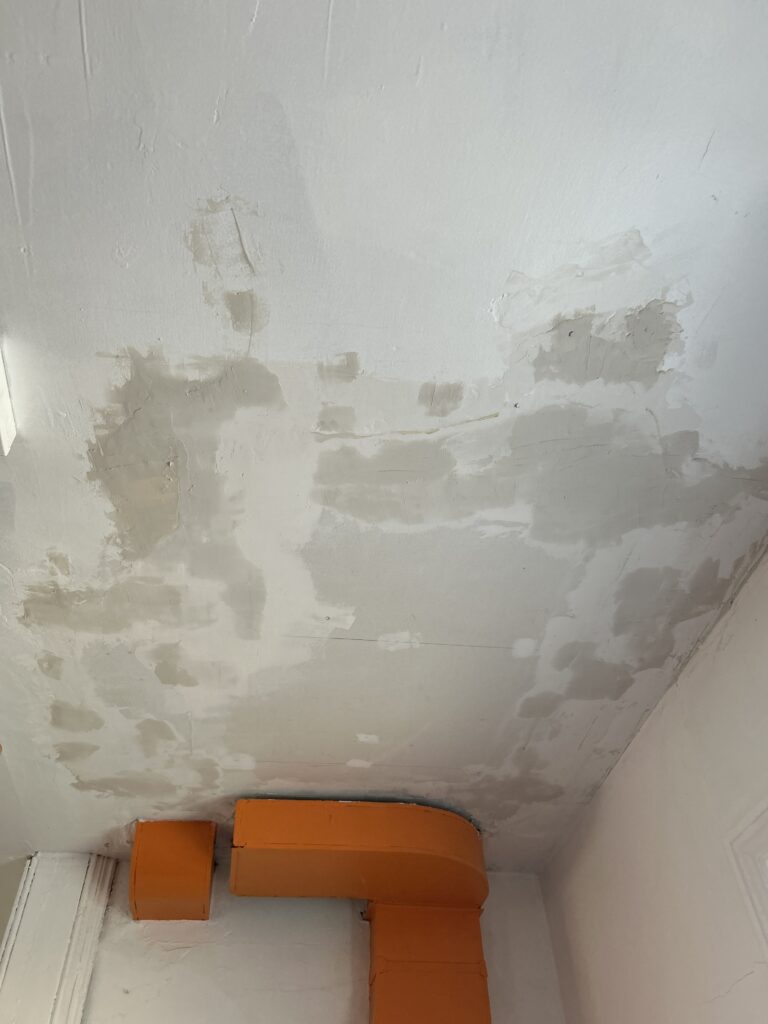
It’s odd to say that a chunk of collapsing ceiling in my kitchen made me grateful, but here we are.
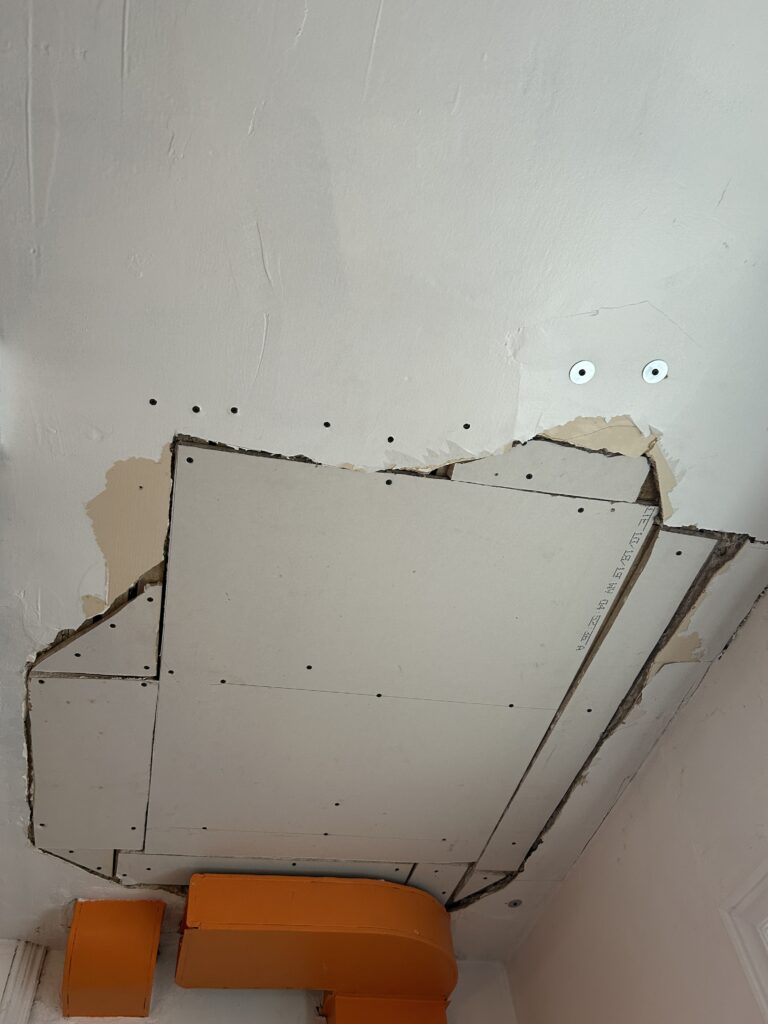
It’s great to have the kind of upbringing that made me feel like I could tackle this; friends who know a lot more about drywall than I do to help me figure this out, the available cash to buy what I needed for the fix, the tools to do it, the time to do it.
Zooming out, it’s given me a chance to reflect on what really rankles me about an age where we’re moving backwards on sensible taxation, public services, and a general understanding of a social safety net. I could point at this fix and say “I did it all myself,” but the truth is, I didn’t.
Accidents of birth, how I was raised and educated, prior good fortune in finding the kind of jobs that gave me cash I could flex into this, a network of friends, the kind of career that grants me time and mental space to envision the fix and have the energy to tackle it. SO MUCH has happened to help me be a guy without a hole in the ceiling.
Nobody “did it all themselves.” We’re all parts of complex systems. We need to recognize that being the person with the time, energy, friends and stuff to fix the hole means we have a responsibility to look out for the people who can’t fix their holes. Or create systems that help them do that.
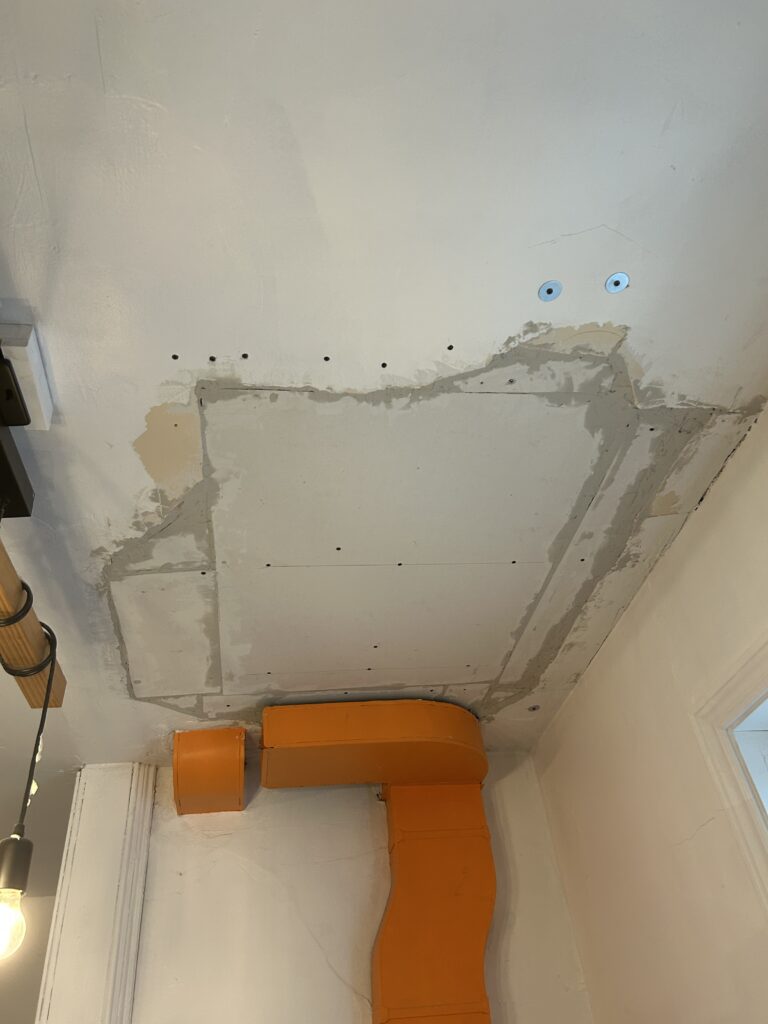
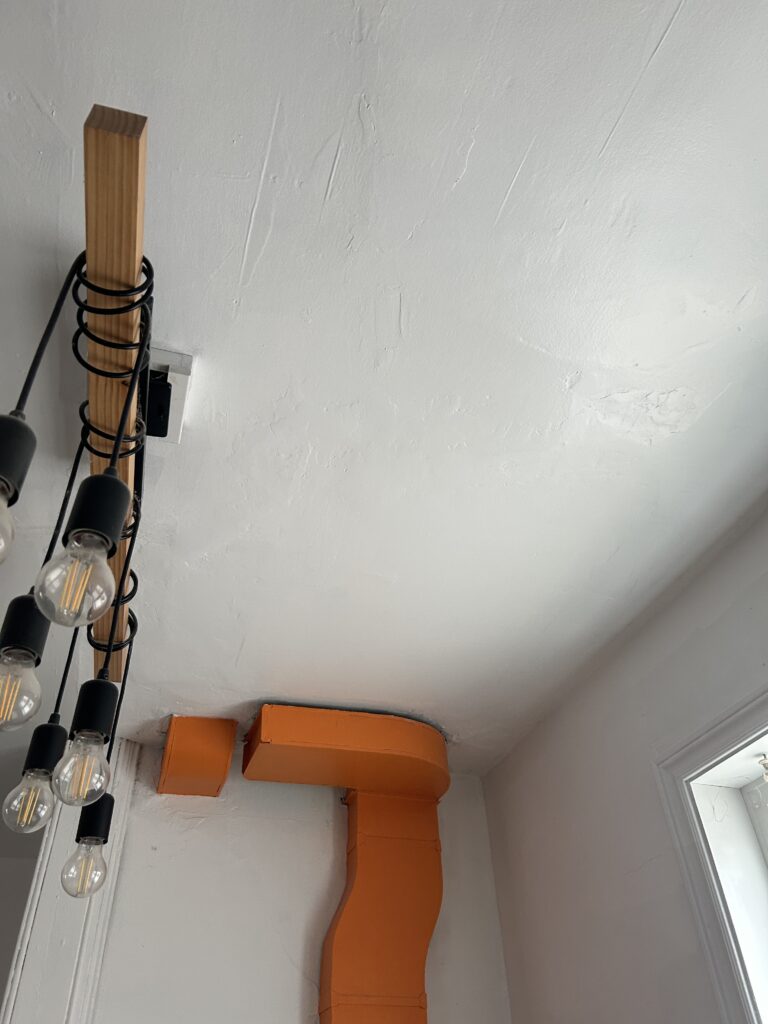
(also, I know it’s not that great a patch, but it’s a 100+ year old house and you should see the rest of the ceiling!)